Friday, July 17, 2015

PR's left and right

Hey, everybody!


It's been a while since I made a big post--$h!t got crazy what with finding a new apartment to call home, packing all of the books I've accumulated over the years, etc. 

However...it has been an extremely productive last couple of weeks, with a couple bits of code merged into the main project branch, and a few other sitting in PR's. 

So let's rap.

Mass of air? Para-what angle??

As mentioned in a previous post, I've been working on some plotting functions for my Google Summer of Code project, part of the Astroplan project. 

Code says what?


After testing preliminary code in some IPython notebooks, I transferred this code to .py files.  An IPython notebook is essentially a frozen interactive programming session--you can write, modify and run code from a web browser and immediately see any results (i.e., plots, numerical output, etc.), but unlike a normal interactive session in IPython, you can save your code AND output.  A file that ends in .py is just code--no output--and so it's more efficient to store bits of code for a complex project in this type of file.  Other bits of code, either in IPython notebooks or .py files, can call the code you save in a .py file, which may contain descriptions of classes, functions and other objects (see my post here)

So, when you've got very preliminary code, it's nice to have it in IPython notebooks, but once it's (mostly) in working order, you need to transfer it to a .py file and put it in the appropriate place in your copy of the repository you're working on.  The usual place to put your Python code is in the source code sub-directory, which tends to have the same name as your project.  For instance, our project, Astroplan, has a root directory, astroplan.  Inside this directory is another one, also called astroplan, and this is where we put our source code. 

Dem files!


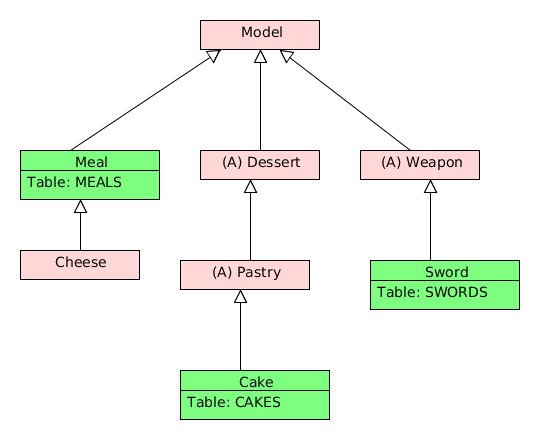
Most projects will have even more subdirectories, each one containing source code for a particular aspect.  In order for all this code to communicate with each other, each source directory (including the main one) has to have an __init__.py file. 

When a module such as Astropy is being used, __init__.py files help communicate to your Python installation where to look for useful functions, objects, etc., and to make sure there's no confusion about which .py file contains the source code.  This is why you can have two modules both containing a function with the exact same name--Python module importing conventions (e.g., "from astropy.coordinates import EarthLocation") plus the __init__.py files make sure everything stays organized. 

The plot increases in viscosity--yet again!*

What all the above meant for me was that I had to figure out how all this worked before I could use my newly-minted plotting functions.  When you're working on a development copy of a software package, you don't really want to install it in the usual way (if you even have that option).  You'll want to do a temporary, "fake" installation of the code you do have so that you can test it (python setup.py build, anyone?).  Sometimes this means you'll have to take the extra step of informing your current Python/IPython session where this installation lies. 


Plots or it didn't happen

The plotting functions for airmass and parallactic angle went through several iterations, and had to wait for some PR's from Brett to get merged in order to use our project's built-in airmass and parallactic angle functions.  My PR containing the plot_airmass and plot_parallactic functions finally merged recently--check it out!  It also contains some IPython notebooks examples on the usage of these, which will eventually migrate to our documentation page.


Airmass vs. Time for 3 targets as seen from Subaru Telescope on June 30, 2015.

Parallactic Angle vs. Time for the same three targets.  Polaris would make a horrible target.


You may notice that the sky plot is missing here--due to technical issues, I moved it to a separate PR.  It's unfinished, and hopefully my mentors will have some suggestions *cough, cough* as to how to figure out the funky grid stuff


Thursday, July 9, 2015

Quick Update - Sunday, 5 July to Thursday, 9 July

Quick update!

This week, I have:

1) Updated the PR with plot_airmass and plot_parallactic, as well as example notebooks.
2) Made another branch for plot_sky.

Sunday, July 5, 2015

Quick Update - Thursday, 2 July 2015

Quick update!

Today, I:
1) Pushed a PR with functions and example notebooks for airmass and parallactic angle plots.
2) Worked on plot_sky issues.

Thursday, July 2, 2015

Quick Update - Wednesday, 1 July 2015

Quick update!


Today, I:

1)  Made a PR for plot_airmass and plot_parallactic, as well as some example notebooks for their use.

Wednesday, July 1, 2015

Quick Update - Monday, 29 June and Tuesday, 30 June 2015

Quick update!

The last two days, I:
1) Updated plots.py to reflect the updated core.py functions.
2) Updated example notebooks to include those Astroplan objects/functions.

Quick Update - Friday, June 26 2015

Quick update!

Today, I:

1) Worked on plots.py
2) Worked on plotting example ipython notebooks.

Friday, June 26, 2015

Quick Update - Thursday 26 June 2015

Quick update!

Today, I:
1) Solved some module import problems by fixing a path issue.
2) Made an ipython notebook with examples on how to use the plot_airmass function.
3) Modified plots.py.

Thursday, June 25, 2015

Quick Update - Wednesday, 25 June 2015

Quick update!

Today, I:

1) Started a plotting examples notebook (to both test plots.py and to showcase to use the plotting methods).
2) Tried to figure out why I couldn't import my plotting methods from the examples notebook.

Wednesday, June 24, 2015

Quick Update - Tuesday 23 June 2015

Quick update!

Today, I:

1) Updated the plotting api PR and responded to comments.
2) Had a meeting with the Astroplan team.
3) Worked on plots.py, the code for the plotting aspect of Astroplan.

Tuesday, June 23, 2015

Quick Update - Monday, 22 June 2015

Quick update!

Today (and this past weekend), I:

1) Played around with astropy.time
2) Updated the plotting API strawman.

Friday, June 19, 2015

Are we coding now?

¡Hola!

As sad as I am that México did not make it out of the group stages in the 2015 FIFA Women's World Cup, I managed to pull myself out of my depression long enough to get some work done on my Google Summer of Code project. 

...And what do you know, I even got a pull request merged into Astroplan's master code. :) 

Insert boastful Drake lyrics here.

My baby code goes to kindergarten 

I worked on PR #5 to Astroplan (containing my contribution to the core code of the project, as well as documentation outlined in my last big post) for what I'm sure was too much of last week. 

I was getting very cryptic error messages when I tried to build the documentation.  I eventually figured out that this had to do with the fact that the old documentation files were not being deleted.  This meant that whenever I changed the name of a class or removed it all together, the Sphinx environment was still looking for the old one. 

One of my mentors, Erik, gave me two possible solutions:
  1. Force git to delete all untracked files (Sphinx docs are rebuilt from the repo, so by default, Astroplan's .git_ignore file includes any generated documentation files)
    •  git clean -dfx
  2. Tell Sphinx to delete all old files from any previous document builds
    • python setup.py build_sphinx -l

 I think I tried the first one, but I can't remember.  

At any rate, the docs built, and the skeleton code I wrote is currently being adopted by my fellow Astroplan GSoCer, Brett, into the actual code base for our project.  Exciting!

Matplotlib & Me

The next big part of the project that I'm (still) working on is implementing the plotting aspect of Astroplan.  

At minimum, we want the three following types of plots:
  1. Airmass vs. Time
  2. Parallactic angle vs. Time
  3. Sky chart 
I now have rudimentary versions of all three types of plots, which look fine--other than the fact that it's hard to feed Matplotlib a series of times formatted like 1200 & 0300 instead of 12:00pm & 3:00pm and expect it to plot data for 3pm *after* the data from noon, so my time-based plots don't look quite right.  


However, I did manage a damn fine sample sky chart if I do say so myself.

One thing I have found out about matplotlib (the Python plotting library) is that, for some reason, you MUST plot points BEFORE you set the ticks and tick labels.  

Also, you will have an excruciatingly "fun" time creating a plot in any projection other than Cartesian (one horizontal and one vertical axis, for all you non-math nerds religiously reading this blog) when 99% of the matplotlib plotting examples and tutorials assume you have x- and y-axes.


Almost as much as this guy.


Thursday, June 18, 2015

Quick Update - Wednesday, 17 June 2015

Quick update!

Today I:
1) Figured out how to get a rudimentary sky plot with radial ticks/labels increasing towards the zenith and cardinal direction annotations.

Quick Update - Tuesday, 16 June 2015

Quick update!

Today I:

1) Worked on rudimentary sky-plotting examples.
2) Met with my mentors and our collaborators. 

Monday, June 15, 2015

Quick Update - Monday, 15 June 2015

Quick update!

Today I:

1) Figured out how to build dictionaries to hold generated coordinate data for targets.
2) Worked on making a sky chart plot to show target locations.

Sunday, June 14, 2015

Quick Update - Sunday, 14 June 2015

Quick update!

Today I:

Researched and wrote up simple test plotting functions for airmass and parallactic angle.

Quick Update - Thursday, 12 June 2015

Quick update!

Today I:

1) Worked on improving core.py and debugging resulting Sphinx documentation
2) Meet with mentors and solved Sphinx documentation problems

Thursday, June 11, 2015

Quick Update - Wed, 10 June 2015

Quick update!

Today (and the day before) I:

Fought with some "AttributeError" messages while building --haven't figured out the issue exactly, but something to do with Sphinx not updating the class/method names from core.py.

Friday, June 5, 2015

Quick Update - Thursday, 4 June 2015

 Quick update!

Today I:

1) Finally figured out Sphinx documentation (?)
2) Worked on plotting API stuff.

Wednesday, June 3, 2015

A witty title evades me.

Hello, internet friends! 


It's been a long, long week of figuring out how to:

  1. Use the tools necessary to build the documentation for an Astropy-affiliated package.
  2. Code up the source skeleton for Astroplan and
  3. Plan out the API for the plotting branch of our project.

Also: basic, human greetings.


Mock documentation is mocking me.

Putting together the basic Sphinx documentation for a mock source code file in Python seemed pretty straightforward, but it took me a couple of tries to get the HTML files built.  These are the same HTML files that you see in a web browser when you go to a project's Read The Docs page (such as Astropy's).

These are important because not only do they serve as a user manual of sorts--providing useful examples and directions on syntax--but they also describe the structure of the code you're building.  In other words, they show how the "objects" in object-oriented programming are related to the functions that make your software useful.

If the hierarchy of classes, subclasses, and methods is still a bit vague even after perusing the examples (either because you're new to object-oriented code, or a human of normal intelligence, or both), a visual such as an inheritance diagram can be a great way to understand all of the relationships.

Including your unhealthy one with food and violence.

To get Sphinx to work with the setup that Astropy uses (and that we shall use), you have to:
  1. Put the code files describing all of your classes, etc. in the folder that contains the source for that module.  For instance, astropy.cosmology's code is in astropy/astropy/cosmology
  2. Edit the index.rst file associated with that module.  This is the file that generates all the text for your module's documentation webpage.  It also contains commands particular to Sphinx for things like formatting and inheritance diagrams; astropy.cosmology's index.rst is in astropy/docs/cosmology.
  3. The last thing you have to do to get the inheritance diagram to show is not as obvious.  Sphinx is telling me to add on ".. inheritance-diagram:: <class or module names>" at the end, but Erik, one of my mentors, assures me that the ".. automodapi::" option in the file should take care of the inheritance command internally....will update when this gets resolved.

Baby steps

An important part of putting together docs and inheritance diagrams for Astroplan is to plan out the basic hierarchy of the classes and methods.

So, for instance, we want to treat an astronomer in an observatory (or even an amateur just looking at the sky from some location) as an object within the framework of Astroplan, thus the Observer class.  Each Observer object will have certain attributes (such as latitude and longitude on Earth, elevation, etc.), and each method acting on an object will perform a specific function or calculation (such as finding out the next time the Sun rises from the observer's location).

For my part, I've taken my fellow Astroplan GSoC-er Brett's API discussion and turned it into skeleton code or frame upon which to add the full-fledged source code (once its written).

In other words, I've made some baby code, soon to grow up into big, strong, kick-ass software.

Close enough.

The plot thickens

The thing about scientists is: We.  Friggin'.  Love.  Plots.

And diagrams.

And graphs.

You show us visual representation of data, and we're all over it like...scientists all over data. 

He's not usually this excited to see us, though.

Inevitably, some astronomer using Astroplan will want to see some plots, and who are we to deny them? 

The plots most crucial to observation planning are probably airmass vs time, parallactic angle vs time, and a skychart showing where targets and guide stars are in the sky at a given point.  We're still deciding which others we will include in Astroplan by the end of the summer.

For the time being, I'm coming to terms with how observational astronomers understand and use airmass and parallactic angle--as opposed to how dreamy-eyed theorists with no practical skills like me do, which is to say not at all.  Part of this is knowing which equations to use, what inputs and outputs are necessary, and what options users would like to have.

The next thing is to write up an API showcasing potential usage for these plots (much like Brett's strawman for the overall Astroplan package)--stay tuned! 


Tuesday, June 2, 2015

Quick Update - Monday, 1 June 2015

Quick update!

Today, I:

1) Researched parallactic angle--more on this later.
2) Cleaned up code for an observation use case written in Skyfield that generates alt/az coordinates for a few different objects.

Monday, June 1, 2015

Quick Update - Sunday, 31 May 2015

Quick update!

Over the weekend, I:

1) Researched airmass--more on this later.

Friday, May 29, 2015

Quick Update - Friday, 29 May 2015

Quick update!

Today I:

  1.  Wrote up core.py, code that will serve as a starting place for the core of astroplan, our observation planning toolbox.  
  2. I also modified index.rst in astroplan/docs, which serves as a documentation hub for existing code, including the hierarchy of classes and methods. 
  3. Made a PR for the modified files.
  4. Still working on figuring out how Sphinx documentation works...

Tuesday, May 26, 2015

The Real Work Starts Now

Since my last post, several things have happened:


1) I got accepted to Google Summer of Code 2015 (yaaayy!!!)

2) The project I ended up choosing, telescope observation planning with Python and Astropy, has been in the planning stages for the last month.  Another student who joined the project, Brett Morris, was also accepted to GSoC, and together with our mentors, we've started to plan out the structure of the code, also known as the API.

3) I've been playing around with existing observation planning packages in Python to prepare for the project (namely Skyfield).

---

So, my first major task is to build the documentation for code that acts as a mock API.  


This came in part out of my need (as a newcomer to structured, open source coding) to better visualize and understand the hierarchy of classes, methods, etc. that make up the strawman API we're using to plan out the code base. 

I'll be using Sphinx to build these documents, as it's what Astropy and affiliated packages use.  The minimum you need to build visualization such as this class inheritance diagram is a skeleton code of placeholders for future, working functions.

My battle plan:
 
Some resources:


Sunday, March 22, 2015

Which project?

As part of my quest to adventure-ously code for open source projects, I'm applying to Google Summer of Code 2015.   I'm looking at two project areas affiliated with Astropy, the astronomer's best friend* when coding in Python.  My potential mentors are professional astronomers and astrophysicists, as well as long-time contributors to Astropy and similar projects.

One possible project would involve putting together a planning tool for observational work.  Our motivation comes from a need to automate the analysis of scheduling telescope time, and do it in a package that "FITS"** in nicely with pre-existing Python work flows.

Some of the thoughts that literally keep astronomers awake at night:

"When will my star/galaxy/X-ray source/etc. be visible, and for how long?"

"Will the moon/other objects/atmospheric effects get me noisy star spectra?"

"Can my telescope's motors move fast enough to view a second or third galaxy in one night?"


???!!!


Tools that answer these questions are constantly being developed by various observatories.  Some existing software packages use languages like C and Javascript.  Since Astropy's goal is to provide a one-stop-shop for all your open source astronomical needs, a Python implementation would be very useful.

The products of such a tool would include the usual plots and tables (airmass, paralletic angle, etc.) and customizable object lists, but would be packaged in an easy-to-use GUI, perhaps with simple animations and web browser capabilities.  The tool would work in requested features from the Astropy community and be used by researchers at various observatories to provide feedback. 


...

"Gee, Jaz, sounds great!  But how would you do actually do it?" 

For starters, I had to learn how to use Git (a back-up system used by programmers).  Then I dug around in the Astropy code repository on GitHub and a couple different developer mailing lists until I knew enough lingo to go undercover as a "real" programmer. 

I also asked the incredibly smart (and super helpful!) astropy-dev community about the procedures for setting up isolated environments for testing code.  I've been practicing my cloning, forking, branching, setup.py'ing, and list-mailing.  So far, so good--no one's blown my cover.  

...but this is only the start!  In the next couple of days, I need to:

  1. Take a closer look at the code base for Potential Project #2, and run some tests on it.  
  2. Skype meet with my potential mentors.  We're scattered across 10+ time zones, so that should be easy.
  3. Submit a patch (bug fix, documentation edit, etc.) to the Astropy code base.  This is required for applications to GSOC under the Python umbrella. 
  4. Get my application hammered out.
  5. ??? You tell me.  It's like 4AM over here.

Footnotes:

*Even if said astronomer has real, human friends.  Unless said human friends know how to write code in Python.  Still waiting on Astropy to accept forgot_wallet=TRUE option when I run letsgobeer().

** Flexible Image Transport System. 


Thursday, March 19, 2015

First Post

Hi Mom, Boyfriend, and People I'm Trying To Impress

...this is my blog!  It's called Jazmin's Open Source Adventure.  Like the page says.  

I'll be writing about writing open source code here, and related stuff--which, like anything on the internet, always involves cats.  

Image stolen from http://rforcats.net/