Hello, internet friends!
It's been a long, long week of figuring out how to:
- Use the tools necessary to build the documentation for an Astropy-affiliated package.
- Code up the source skeleton for Astroplan and
- Plan out the API for the plotting branch of our project.
 |
| Also: basic, human greetings. |
Mock documentation is mocking me.
Putting together the basic Sphinx documentation for a mock source code file in Python seemed pretty straightforward, but it took me a couple of tries to get the HTML files built. These are the same HTML files that you see in a web browser when you go to a project's Read The Docs page (such as Astropy's).These are important because not only do they serve as a user manual of sorts--providing useful examples and directions on syntax--but they also describe the structure of the code you're building. In other words, they show how the "objects" in object-oriented programming are related to the functions that make your software useful.
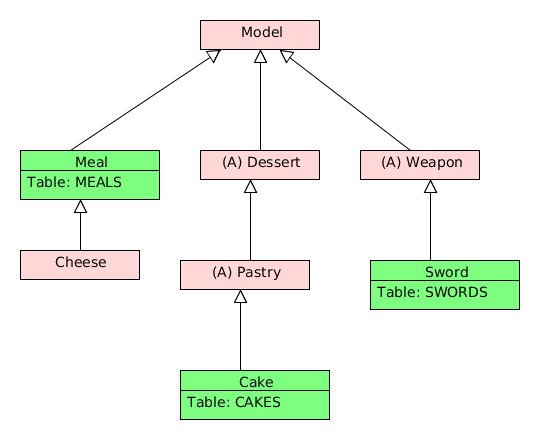
If the hierarchy of classes, subclasses, and methods is still a bit vague even after perusing the examples (either because you're new to object-oriented code, or a human of normal intelligence, or both), a visual such as an inheritance diagram can be a great way to understand all of the relationships.
 |
| Including your unhealthy one with food and violence. |
To get Sphinx to work with the setup that Astropy uses (and that we shall use), you have to:
- Put the code files describing all of your classes, etc. in the folder that contains the source for that module. For instance, astropy.cosmology's code is in astropy/astropy/cosmology.
- Edit the index.rst file associated with that module. This is the file that generates all the text for your module's documentation webpage. It also contains commands particular to Sphinx for things like formatting and inheritance diagrams; astropy.cosmology's index.rst is in astropy/docs/cosmology.
- The last thing you have to do to get the inheritance diagram to show is not as obvious. Sphinx is telling me to add on ".. inheritance-diagram:: <class or module names>" at the end, but Erik, one of my mentors, assures me that the ".. automodapi::" option in the file should take care of the inheritance command internally....will update when this gets resolved.
Baby steps
An important part of putting together docs and inheritance diagrams for Astroplan is to plan out the basic hierarchy of the classes and methods.So, for instance, we want to treat an astronomer in an observatory (or even an amateur just looking at the sky from some location) as an object within the framework of Astroplan, thus the Observer class. Each Observer object will have certain attributes (such as latitude and longitude on Earth, elevation, etc.), and each method acting on an object will perform a specific function or calculation (such as finding out the next time the Sun rises from the observer's location).
For my part, I've taken my fellow Astroplan GSoC-er Brett's API discussion and turned it into skeleton code or frame upon which to add the full-fledged source code (once its written).
In other words, I've made some baby code, soon to grow up into big, strong, kick-ass software.
 |
| Close enough. |
The plot thickens
The thing about scientists is: We. Friggin'. Love. Plots.And diagrams.
And graphs.
You show us visual representation of data, and we're all over it like...scientists all over data.
 |
| He's not usually this excited to see us, though. |
Inevitably, some astronomer using Astroplan will want to see some plots, and who are we to deny them?
The plots most crucial to observation planning are probably airmass vs time, parallactic angle vs time, and a skychart showing where targets and guide stars are in the sky at a given point. We're still deciding which others we will include in Astroplan by the end of the summer.
For the time being, I'm coming to terms with how observational astronomers understand and use airmass and parallactic angle--as opposed to how dreamy-eyed theorists with no practical skills like me do, which is to say not at all. Part of this is knowing which equations to use, what inputs and outputs are necessary, and what options users would like to have.
The next thing is to write up an API showcasing potential usage for these plots (much like Brett's strawman for the overall Astroplan package)--stay tuned!
No comments:
Post a Comment